DRAFT: Not for quotation or citation. Comments would be greatly appreciated.
Paper presented at the Annual Conference of the American Evaluation Association, Dallas, Texas, November 6, 1993. This research was supported in part through NIMH Grant R01MH46712-01A1, William M.K. Trochim, Principal Investigator.
Because of the growing interest in and use of the concept mapping methodology, it is important to define rigorous and feasible standards of quality. This paper addresses the issue of the reliability of concept mapping. Six different reliability coefficients that can easily be estimated from the data typically available from any concept mapping project were defined and estimated for 38 different concept mapping projects. Results indicate that the concept mapping process can be considered reliable according to generally-recognized standards for acceptable reliability levels. It is recommended that the reliabilities estimated here be routinely reported with concept mapping project results.
Concept mapping is a process that can be used to help a group describe its ideas on any topic of interest (Trochim, 1989a). The process typically requires the participants to brainstorm a large set of statements relevant to the topic of interest, individually sort these statements into piles of similar ones and rate each statement on some scale, and interpret the maps that result from the data analyses. The analyses typically include a two-dimensional multidimensional scaling (MDS) of the unstructured sort data, a hierarchical cluster analysis of the MDS coordinates, and the computation of average ratings for each statement and cluster of statements. The maps that result show the individual statements in two-dimensional (x,y) space with more similar statements located nearer each other, and show how the statements are grouped into clusters that partition the space on the map. Participants are led through a structured interpretation session designed to help them understand the maps and label them in a substantively meaningful way.
The concept mapping process as discussed here was first described by Trochim and Linton (1986). Trochim (1989a) delineates the process in detail and Trochim (1989b) presents a wide range of example projects. Concept mapping has received considerable use and appears to be growing in popularity. It has been used to address substantive issues in the social services (Galvin, 1989; Mannes, 1989), mental health (Cook, 1992; Kane, 1992; Lassegard, 1993; Marquart, 1988; Marquart, 1992; Marquart et al, 1993; Penney, 1992; Ryan and Pursley, 1992; Shern, 1992; Trochim, 1989a; Trochim and Cook, 1992; Trochim et al, in press; Valentine, 1992), health care (Valentine, 1989), education (Grayson, 1993; Kohler, 1992; Kohler, 1993), educational administration (Gurowitz et al, 1988), and theory development (Linton, 1989). Considerable methodological work on the concept mapping process and its potential utility has also been accomplished (Bragg and Grayson, 1993; Caracelli, 1989; Cooksy, 1989; Davis, 1989; Dumont, 1989; Grayson, 1992; Keith, 1989; Lassegard, 1992; Marquart, 1989; Mead and Bowers, 1992; Mercer, 1992; SenGupta, 1993; Trochim, 1985 , 1989c, 1990).
Given the broad and apparently increasing utilization of the concept mapping method, it is increasingly important that issues related to the quality of the process be investigated. In most social science research, the quality of the measurement is assessed through estimation of reliability and validity. This paper considers only the reliability of concept mapping.
The traditional theory of reliability typically applied in social research does not fit the concept mapping model well. That theory assumes that for each test item there is a correct answer that is known a priori. The performance of each individual is measured on each question and coded correct or incorrect. Data are typically stored in a rectangular matrix with the rows being persons and the columns test items. Reliability assessment focuses on the test questions or on the total score of the test. That is, we can meaningfully estimate the reliability of each test item, or of the total score.
Concept mapping involves a different emphasis altogether. There is no assumed correct answer or correct sort. Instead, it is assumed that there may be some normatively typical arrangement of the statements that is reflected imperfectly in the sorts of all members who come from the same relatively homogeneous (with respect to the construct of interest) cultural group. The emphasis in reliability assessment shifts from the item to the person. For purposes of reliability assessment, the structure of the data matrix is reversed, with persons as the columns and items (or pairs of items) as the rows. Reliability assessment focuses on the consistency across the assumed relatively homogeneous set of participants. In this sense, it is meaningful to speak of the reliability of the similarity matrix or the reliability of the map in concept mapping, but not of the reliability of individual statements.
This paper presents several ways of estimating the reliability or consistency of concept mapping. The various estimates of reliability are illustrated on data from a large heterogeneous group of prior concept mapping projects. The distributions of reliability estimates across many projects provide realistic estimates of the level of reliability one might expect in typical field applications of concept mapping.
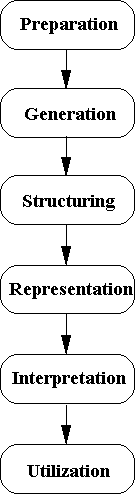
Traditional presentations of concept mapping describe it as a six-step process as depicted in Figure 1.
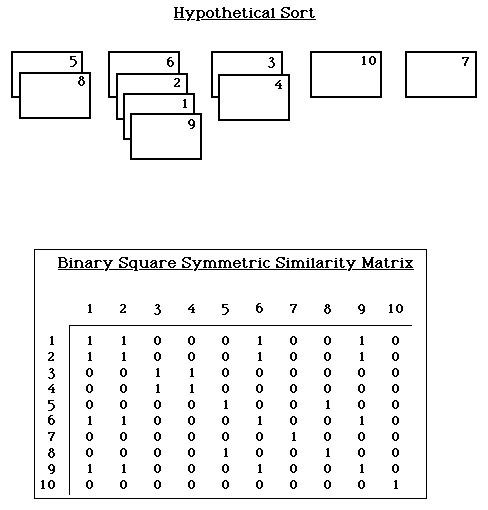
During the preparation step, the focus for the concept mapping is operationalized, participants are selected, and a schedule is developed. The generation step is usually accomplished through a simple brainstorming (Osborn, 1948) of a large set of statements related to the focus. In the structuring step, each participant completes an unstructured sorting (Rosenberg and Kim, 1975; Weller and Romney, 1988) of the statements into piles of similar ones, and rates each statement on some dimension of relevance. The representation step consists of the major statistical analyses. The analysis begins with construction from the sort information of an NxN (where N is the total number of statements) binary, symmetric matrix of similarities, SNxN for each participant. For any two items i and j, a 1 is placed in Sij if the two items were placed in the same pile by the participant, otherwise a 0 is entered (Weller and Romney, 1988, p. 22). The construction of this individual matrix is illustrated in Figure 2.
The total NxN similarity matrix, TNxN is obtained by summing across the individual SNxN matrices. Thus, any cell in this matrix can take integer values between 0 and M (where M is the total number of people who sorted the statements); the value indicates the number of people who placed the i,j pair in the same pile. The total similarity matrix TNxN is analyzed using nonmetric multidimensional scaling (MDS) analysis (Kruskal and Wish, 1978; Davison, 1983) with a two-dimensional solution. The solution is limited to two dimensions because, as Kruskal and Wish (1978) point out:
Since it is generally easier to work with two-dimensional configurations than with those involving more dimensions, ease of use considerations are also important for decisions about dimensionality. For example, when an MDS configuration is desired primarily as the foundation on which to display clustering results, then a two-dimensional configuration is far more useful than one involving three or more dimensions (p. 58).
The analysis yields a two-dimensional XNx2 configuration of the set of N statements based on the criterion that statements piled together most often are located more proximately in two-dimensional space while those piled together less frequently are further apart.
This two-dimensional configuration is the input for the hierarchical cluster analysis utilizing Ward's algorithm (Everitt, 1980) as the basis for defining a cluster. Using the MDS configuration as input to the cluster analysis in effect forces the cluster analysis to partition the MDS configuration into non-overlapping clusters in two-dimensional space. In the interpretation step, the participant group is guided by the facilitator through a structured process that familiarizes them with the various maps and enables them to attach meaningful substantive labels to various locations on the map. Finally, in the utilization step, the participants discuss specific ways the maps can be used to help address the original focus of the project.
Because the concept mapping process is so complex, it is difficult to conceive of a single overall reliability coefficient. For instance, it would be theoretically feasible to ask about the reliability of any of the six phases of the process independent of the others. Nevertheless, it is clear that the central product of the concept mapping process is the two-dimensional map itself and, consequently, efforts to address reliability are well-directed to the central phases of the analysis, the structuring and representation steps. In this paper, the focus is on methods for estimating the reliability of the sort data and of the two-dimensional MDS map that results.
The key components of the concept mapping process available for estimating various reliabilities are shown in Figure 3.
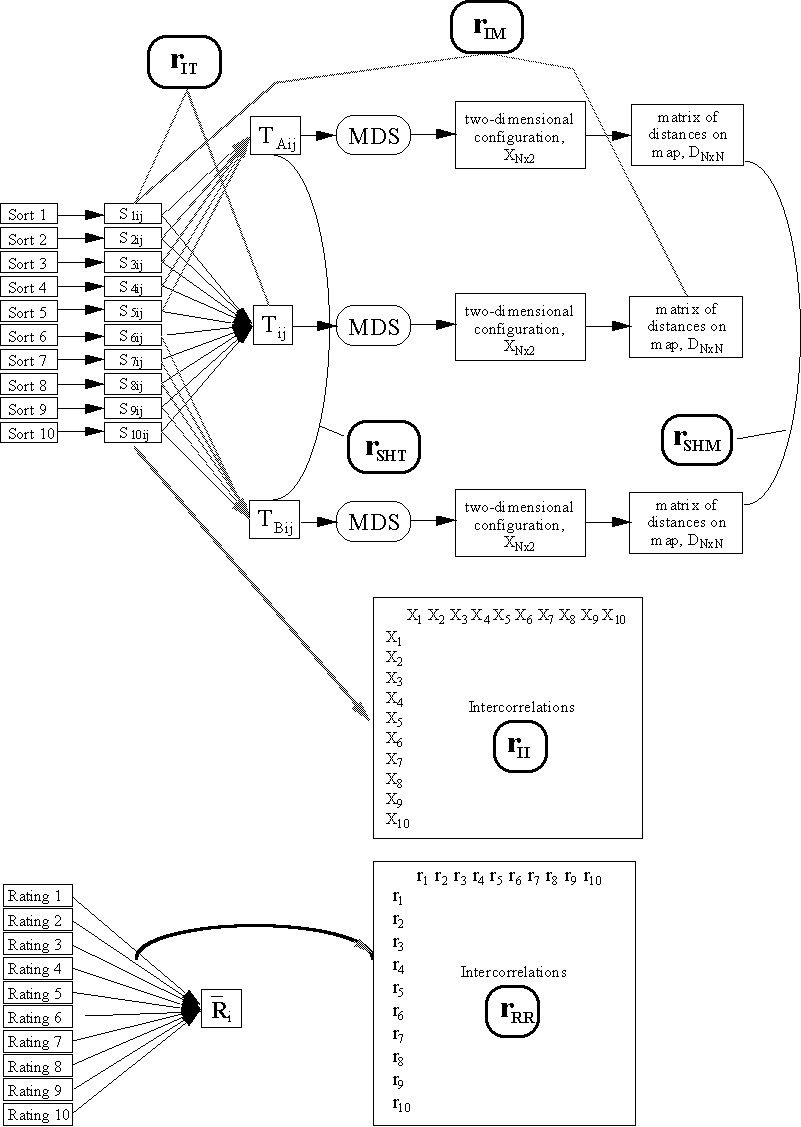
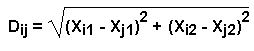
The figure assumes a hypothetical project involving ten participants (M=10), each of whom sorted and rated the set of N statements. We see that for each sort, there is a corresponding binary symmetric similarity matrix, SNxN. These are aggregated into the total matrix, TNxN. This total matrix is the input to the MDS analysis which yields a two-dimensional XNx2 configuration. The Euclidean distances (in two dimensions) between all pairs of statements can be computed directly from the two-dimensional matrix, yielding a distance matrix DNxN where:
The ratings are analyzed separate from the sort data, as indicated in the figure.
Although the assumptions underlying reliability theory for concept mapping are different from traditional reliability theory, the methods for estimating reliability would be familiar to traditionalists. Several common reliability estimators are considered below. From these, a subset set of estimators is selected that can readily be obtained from the data for any typical concept mapping project.
One common estimator of reliability is the test-retest correlation. Typically, respondent scores on successive administrations of a test are correlated to estimate the degree of consistency in repeated testings. In concept mapping, this could be accomplished by asking the same participants to sort the statements on two separate occasions. Two reliability coefficients could be computed. One would involve the correlation between the aggregated similarity matrix, TNxN (the input to MDS) on both occasions. The other would be the correlation between the two MDS maps that result (specifically, the correlation between the distances between all pairs of points on the two maps, DNxN). The test-retest correlation has several disadvantages as a reliability estimator in a concept mapping context. It assumes that participants do not change with respect to what is being measured (or change only in a linear fashion) between testings and that the first testing does not affect the response on the second. More practically, the test-retest method requires twice the data collection. Participants would usually need to be assembled on separate days, significantly increasing the costs and feasibility of a project. Although the test-retest reliability estimate should be used where practicable, it is not used here to estimate reliability.
A second traditional way to estimate reliability would be to divide the set of test items into two random subtests and compute the correlation for these across the participants. This "split half" reliability can also be accomplished for the concept mapping case. Here, one would divide the participant group randomly into two subgroups, labeled A and B. Separate similarity matrices (TA and TB) and MDS maps (XA and XB) can be computed for each subgroup, as shown in Figure 3. By correlating them, one can then estimate the split half reliability of the similarity matrix and of the map that results. The split half reliability has the advantage of being relatively easy to compute from any concept mapping data. Both split half reliabilities are studied here.
In traditional reliability estimation, Cronbach's alpha is often used and is considered equivalent to computing all possible split half reliabilities. This would clearly be superior to the simple split half estimator, but there is no known way to estimate alpha for the matrix data used in concept mapping. Even if one could accomplish this for the sort data, one would need to compute MDS maps for each potential split half in order to estimate the equivalent to Cronbach's alpha -- clearly a prohibitively time consuming proposition. For this reason, no Cronbach's alpha estimate of reliability is considered here.
Another traditional reliability estimate involves the degree to which each test item correlates with the total score across all items on the test. This average item-total reliability has an analogue in concept mapping. One can compute the correlation between each person's binary sort matrix, SNxN, and the total similarity matrix, TNxN, and between each person's binary sort matrix, SNxN, and the distances on the final map, DNxN. These will be labeled here the Average Individual-to-Total reliability and the Average Individual-to-Map reliability.
A final traditional reliability estimate is based on the average of the correlations among items on a scale, or the average interitem correlation. It is possible to perform an analogous analysis with concept mapping data, on both the sorting and rating data. These will be termed here the average Individual-to-Individual sort and the average Rating-to-Rating reliabilities.
Most of the estimation methods described above (except for test-retest
and Cronbach's alpha) rely on calculations that are based on only
part of the total available sample of participants. For instance,
the split-half reliability has an effective sample size of one-half
the total number of participants. The three averaged estimates
are even worse off, relying on only a single individual or pair
as the effective sample size for each element entered into the
average. Since we know that reliability is affected by the number
of items on a test (or persons in a concept mapping project),
these correlations based on only part of the participant sample
do not accurately reflect the correlational value we would expect
for the entire participant sample. This is traditionally corrected
for in reliability estimation by applying the Spearman-Brown Prophecy
Formula (Nunnally, 1978, p. 211):
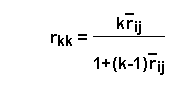
where:
rij = the correlation estimated from the data
k = N/n where N is the total sample size and n is the sample size on which rij is based
rkk = the estimated Spearman-Brown corrected reliability
In sum, there appear to be several reliability estimates that can be routinely constructed from any concept mapping data. All of them require use of the Spearman-Brown correction. They are:
1. The Split-Half Total matrix reliability, rSHT
2. The Split-Half Map reliability, rSHM
3. The Average Individual-to-Total Reliability, rIT.(k = N/1)
4. The Average Individual-to-Map Reliability, rIM.(k = N/1)
5. The Average Individual-to-Individual Sort Reliability, rII. (k = N/1)
6. The Average Rating-to-Rating Reliability, rRR.(k = N/1)
Thirty-eight separate concept mapping projects conducted over the past two years constituted the sample for this reliability study. This is essentially exhaustive of the universe of all concept mapping projects conducted by the author over that time period. Almost all of the projects could be classified generally as in the area of social services research. Most (N=18) were in the field of mental health. Three were related to arts organization administration. There were two each in health and agriculture. Three were primarily focused on research methodology issues (such as the conceptualization of what is meant by measurement). There were 10 other studies that were classified generally as social services in nature.
All of the reliabilities calculated here are depicted graphically in Figure 3 above.
Split-Half Reliabilities. The set of sorts from each project was randomly divided into two halves (for odd-numbered participant groups, one group was randomly assigned one more person than the other). Separate concept maps were computed for each group. The total matrices, TA and TB, for each group were correlated and the Spearman-Brown correction applied to obtain rSHT. The Euclidean distances between all pairs of points on the two maps, DA and DB, were correlated and the Spearman-Brown correction applied to obtain rSHM.
Individual-to-Individual Sort Reliability. The SNxN matrices were correlated for all pairs of individuals. These correlations were averaged and the Spearman-Brown correction applied to yield rII.
Individual-to-Total Matrix Reliability. The SNxN sort matrix for each individual was correlated with the total matrix, TNxN. These correlations were averaged and the Spearman-Brown correction applied to yield rIT.
Individual-to-Map Reliability. The SNxN sort matrix for each individual was correlated with the Euclidean distances, DNxN. These correlations were averaged and the Spearman-Brown correction applied to yield rIM.
Average Inter-Sort Reliability. The correlation between the ratings for each pair of persons was computed. These correlations were averaged and the Spearman-Brown correction applied to yield rRR.
Descriptive statistics for the thirty-eight concept mapping projects are shown in Table 1.
Table 1. Descriptive statistics for the number of statements,
number of sorters, number of raters, and stress values for 38
concept mapping projects.
| Number of Projects | 38 | 37 | 37 | 33 |
| Mean | 83.84211 | 14.62162 | 13.94595 | 0.28527 |
| Median | 93.00000 | 14.00000 | 14.00000 | 0.29702 |
| Minimum | 39.00000 | 7.00000 | 6.00000 | 0.15526 |
| Maximum | 99.00000 | 32.00000 | 33.00000 | 0.35201 |
| SD | 17.99478 | 5.77038 | 5.69086 | 0.04360 |
On average, 83.8 statements were brainstormed across all projects, with a range from 39 to 99. Most projects achieved over 90 statements (median=93). There were an average of 14.62 sorters per project, very close to the typically recommended sample size of fifteen. The reason there are only 37 projects for the sorting is that two of the projects were related and used the same sort statements, with one of those doing only the ratings. Similarly, in one of the projects, no ratings were done. The last column shows that the average stress value across the projects was .285 (SD=.04). Stress is a statistic routinely reported for multidimensional scaling that reflects the goodness of fit of the map to the original dissimilarity matrix that served as input. A lower stress value implies a better fit. The multidimensional scaling literature suggests that a lower stress value is desired than is typically obtained in concept mapping. However, it must be remembered that the recommendations in the literature are typically based on experience with much more stable phenomena (e.g., physiological perception of color similarities), fewer entities, and more precise measurement methods (e.g., paired comparisons). The data summarized in Table 1 are important benchmarks that can act as reasonable standards for the level of stress that should be expected in typical field-based concept mapping projects.
Table 2 shows the descriptive statistics for the stress values for the sample projects and for their split half samples.
Table 2. Descriptive statistics for the stress values for the
entire project and the split-half samples for 38 concept mapping
projects.
|
| ||
| Number of Projects | 33 | 33 | 33 |
| Mean | 0.28527 | 0.30013 | 0.29987 |
| Median | 0.29702 | 0.31421 | 0.31082 |
| Minimum | 0.15526 | 0.19962 | 0.14875 |
| Maximum | 0.35201 | 0.34437 | 0.36855 |
| SD | 0.04360 | 0.03772 | 0.04654 |
The major value of this table is that it gives some indication of the effect of sample size (i.e., number of sorters) on final stress values. Somewhat surprisingly, the table suggests that stress values based on sample sizes half as large are nearly as good as the full-sample values, suggesting that even smaller samples of sorters may produce maps that fit almost as well as samples twice as large.
The estimates of reliability are reported in Table 3.
Table 3. Descriptive statistics for reliability estimates for
38 concept mapping projects.
| Number of Projects |
33 | 37 | 33 | 33 | 33 | 33 |
| Mean | 0.81507 | 0.78374 | 0.92965 | 0.86371 | 0.83330 | 0.55172 |
| Median | 0.82060 | 0.82120 | 0.93070 | 0.86280 | 0.84888 | 0.55881 |
| Minimum | 0.67040 | 0.42700 | 0.88230 | 0.74030 | 0.72493 | 0.25948 |
| Maximum | 0.93400 | 0.93540 | 0.97370 | 0.95490 | 0.93269 | 0.90722 |
| SD | 0.07016 | 0.12125 | 0.02207 | 0.04771 | 0.05485 | 0.15579 |
Three of the coefficients (i.e., rII, rIT, and rSHT) utilize only the individual sort matrices and the sum of these. The average individual-to-individual sort reliability value (rII) was .815, the average individual-to-total matrix value (rIT) was .929, and the average split-half total matrix reliability (rSHT) was .833. The only reliability estimate that involved rating values (rRR) yielded an average of .78. It is worth noting that one would typically not expect that there would be as much consistency across a group of persons on the ratings as on sortings. Finally, there were only two reliability estimates that included information from the final map. The average value of the relationship between individuals' sorts and the final map configuration (rIM) was .863. The split-half reliability of the final maps (rSHM) had an average value of .55.
Table 4 shows the relationship between the number of statements and sorters, and the various reliabilities.
Table 4. Correlations between number of statements and number
of sorters and the various reliabilities.
| -0.06232 | 0.54577 | |
| -0.00714 | 0.59122 | |
| -0.15390 | 0.61201 | |
| -0.15483 | 0.54921 | |
| -0.07697 | 0.21373 |
The number of statements is largely uncorrelated with reliability, although all coefficients are slightly negative. On the other hand, the number of sorters is positively correlated with reliabilities. This suggests that having more sorters in a concept mapping project can improve the overall reliability of the results.
Finally, the intercorrelations among the five sort-related reliability
estimates are shown in Table 5.
Table 5. Correlations between different reliability estimates.
| 0.94030 | ||||
| 0.78976 | 0.90937 | |||
| 0.91925 | 0.90301 | 0.77444 | ||
| 0.48329 | 0.59313 | 0.68700 | 0.57188 |
The correlations are all significantly positive, with the lowest correlations between the split-half map reliabilities and all others.
The results indicate that the concept mapping method, when examined across a wide range of projects, yields reliable results as estimated by a number of acceptable reliability indicators.
While all reliability estimates were strongly positive, the split half estimate of the relationship between maps was clearly lower than the rest. It is not surprising that this value is lower. A simple analogy might explain why this is so. Imagine that we had data on a multi-item scale and that we divided the sample of respondents randomly into two halves. If we compute any estimate of reliability of the raw data, it is bound to be higher than estimates of reliability based on analyses that process that data. For instance, if we applied the same regression model or factor analytic model to both random split half samples and correlated the results of these analyses (e.g., the predicted regression values or factor analysis inter-item matrix), they would almost certainly be lower than any reliability based only on the original raw data.
The reliability estimates reported here are all easily calculable from the raw data available from any concept mapping project. These estimates should be reported routinely in write-ups of concept mapping results.
Bragg, L.R. and Grayson, T.E. (1993). Reaching consensus on outcomes: Lessons learned about concept mapping. Paper presented at the Annual Conference of the American Evaluation Association, Dallas, TX.
Caracelli, V. (1989). Structured conceptualization: A framework for interpreting evaluation results. Evaluation and Program Planning. 12, 1, 45-52.
Cook, J. (1992). Modeling staff perceptions of a mibile job support program for persons with severe mental illness. Paper presented at the Annual Conference of the American Evaluation Association, Seattle, WA.
Cooksy, L. (1989). In the eye of the beholder: Relational and hierarchical structures in conceptualization. Evaluation and Program Planning. 12, 1, 59-66.
Davis, J. (1989). Construct validity in measurement: A pattern matching approach. Evaluation and Program Planning. 12, 1, 31-36.
Dumont, J. (1989). Validity of multidimensional scaling in the context of structured conceptualization. Evaluation and Program Planning. 12, 1, 81-86.
Davison, M.L. (1983). Multidimensional scaling. New York, John Wiley and Sons.
Everitt, B. (1980). Cluster Analysis. 2nd Edition, New York, NY: Halsted Press, A Division of John Wiley and Sons.
Galvin, P.F. (1989). Concept mapping for planning and evaluation of a Big Brother/Big Sister program. Evaluation and Program Planning. 12, 1, 53-58.
Grayson, T.E. (1993). Empowering key stakeholders in the strategic planning and development of an alternative school program for youth at risk of school behavior. Paper presented at the Annual Conference of the American Evaluation Association, Dallas, TX.
Grayson, T.E. (1992). Practical issues in implementing and utilizing concept mapping. Paper presented at the Annual Conference of the American Evaluation Association, Seattle, WA.
Gurowitz, W.D., Trochim, W. and Kramer, H. (1988). A process for planning. The Journal of the National Association of Student Personnel Administrators, 25, 4, 226-235.
Kane, T.J. (1992). Using concept mapping to identify provider and consumer issues regarding housing for persons with severe mental illness. Paper presented at the Annual Conference of the American Evaluation Association, Seattle, WA.
Keith, D. (1989). Refining concept maps: Methodological issues and an example. Evaluation and Program Planning. 12, 1, 75-80.
Kohler, P.D. (1992). Services to students with disabilities in postsecondary education settings: Identifying program outcomes. Paper presented at the Annual Conference of the American Evaluation Association, Seattle, WA.
Kohler, P.D. (1993). Serving students with disabilities in postsecondary education settings: Using program outcomes for planning, evaluation and empowerment.Paper presented at the Annual Conference of the American Evaluation Association, Dallas, TX.
Kruskal, J.B. and Wish, M. (1978). Multidimensional Scaling. Beverly Hills, CA: Sage Publications.
Lassegard, E. (1992). Assessing the reliability of the concept mapping process. Paper presented at the Annual Conference of the American Evaluation Association, Seattle, WA.
Lassegard, E. (1993). Conceptualization of consumer needs for mental health services.Paper presented at the Annual Conference of the American Evaluation Association, Dallas, TX.
Linton, R. (1989). Conceptualizing feminism: Clarifying social science concepts. Evaluation and Program Planning. 12, 1, 25-30.
Mannes, M. (1989). Using concept mapping for planning the implementation of a social technology. Evaluation and Program Planning. 12, 1, 67-74.
Marquart, J.M. (1988). A pattern matching approach to link program theory and evaluation data: The case of employer-sponsored child care. Unpublished doctoral dissertation, Cornell University, Ithaca, New York.
Marquart, J.M. (1989). A pattern matching approach to assess the construct validity of an evaluation instrument. Evaluation and Program Planning. 12, 1, 37-44.
Marquart, J.M. (1992). Developing quality in mental health services: Perspectives of administrators, clinicians, and consumers. Paper presented at the Annual Conference of the American Evaluation Association, Seattle, WA.
Marquart, J.M., Pollak, L. and Bickman, L. (1993). Quality in intake assessment and case management: Perspectives of administrators, clinicians and consumers. In R. Friedman et al. (Eds.), A system of care for children's mental health: Organizing the research base. Tampa: Florida Mental Health Institute, University of South Florida.
Mead, J.P. and Bowers, T.J. (1992). Using concept mapping in formative evaluations. Paper presented at the Annual Conference of the American Evaluation Association, Seattle, WA.
Mercer, M.L. (1992). Brainstorming issues in the concept mapping process. Paper presented at the Annual Conference of the American Evaluation Association, Seattle, WA.
Nunnally, J.C. (1978). Psychometric Theory. (2nd. Ed.). New York, McGraw Hill.
Osborn, A.F. (1948). Your Creative Power. New York, NY: Charles Scribner.
Penney, N.E. (1992). Mapping the conceptual domain of provider and consumer expectations of inpatient mental health treatment: New York Results. Paper presented at the Annual Conference of the American Evaluation Association, Seattle, WA.
Romney, A.K., Weller, S.C. and Batchelder, W.H. (1986). Culture as consensus: A theory of culture and informant accuracy. American Anthropologist, 88, 2, 313-338.
Rosenberg, S. and Kim, M.P. (1975). The method of sorting as a data gathering procedure in multivariate research. Multivariate Behavioral Research, 10, 489-502.
Ryan, L. and Pursley, L. (1992). Using concept mapping to compare organizational visions of multiple stakeholders. Paper presented at the Annual Conference of the American Evaluation Association, Seattle, WA.
SenGupta, S. (1993). A mixed-method design for practical purposes: Combination of questionnaire(s), interviews, and concept mapping.Paper presented at the Annual Conference of the American Evaluation Association, Dallas, TX.
Shern, D.L. (1992). Documenting the adaptation of rehabilitation technology to a core urban, homeless population with psychiatric disabilities: A concept mapping approach. Paper presented at the Annual Conference of the American Evaluation Association, Seattle, WA.
Trochim, W. (1985). Pattern matching, validity, and conceptualization in program evaluation. Evaluation Review, 9, 5, 575-604.
Trochim, W. (1989a). An introduction to concept mapping for planning and evaluation. Evaluation and Program Planning, 12, 1, 1-16.
Trochim, W. (1989b). Concept mapping: Soft science or hard art? Evaluation and Program Planning, 12, 1, 87-110.
Trochim, W. (1989c). Outcome pattern matching and program theory. Evaluation and Program Planning, 12, 4, 355-366.
Trochim, W. (1990). Pattern matching and program theory. In H.C. Chen (Ed.), Theory-Driven Evaluation. New Directions for Program Evaluation, San Francisco, CA: Jossey-Bass.
Trochim, W. and Cook, J. (1992). Pattern matching in theory-driven evaluation: A field example from psychiatric rehabilitation. in H. Chen and P.H. Rossi (Eds.) Using Theory to Improve Program and Policy Evaluations. Greenwood Press, New York, 49-69.
Trochim, W. and Linton, R. (1986). Conceptualization for evaluation and planning. Evaluation and Program Planning, 9, 289-308.
Trochim, W., Cook, J. and Setze, R. (in press). Using concept mapping to develop a conceptual framework of staff's views of a supported employment program for persons with severe mental illness. Consulting and Clinical Psychology.
Valentine, K. (1989). Contributions to the theory of care. Evaluation and Program Planning. 12, 1, 17-24.
Valentine, K. (1992). Mapping the conceptual domain of provider and consumer expectations of inpatient mental health treatment: Wisconsin results. Paper presented at the Annual Conference of the American Evaluation Association, Seattle, WA.
Weller, S.C. and Romney, A.K. (1988). Systematic Data Collection.
Sage Publications, Newbury Park, CA.