Generating Data
This exercise will illustrate how simulated data can be created by rolling dice to generate random numbers. The data you create in this exercise will be used in all of the subsequent manual simulation exercises. Think about some test or measure that you might like to take on a group of individuals. You administer the test and observe a single numerical score for each person. This score might be the number of questions the person answered correctly or the average of their ratings on a set of attitude items, or something like that, depending on what you are trying to measure. However you measure it, each individual has a single number that represents their performance on that measure. In a simulation, the idea is that you want to create, for a number of imaginary people, hypothetical test scores that look like the kinds of scores you might obtain if you actually measured these people. To do this, you will generate data according to a simple measurement model, called the "true score" model. This model assumes that any observed score, such as a pretest or a posttest score, is made up of two components: true ability and random error. You don't see these two components when you measure people in real life, you just assume that they are there.
We can describe the measurement model with the formula
O = T + eo
where O is the observed score, T is the person's true ability or response level on the characteristic being measured and eo represents random error on this measure. In real life, all we see is the person's score — the O in our formula above. We assume that part of this number or score tells us about the true ability or attitude of the person on that measure. But, we also assume that part of what we observe in their score may reflect things other than what we are trying to measure. We call this the error in measurement and use the symbol eo to represent it in the formula. This error reflects all the situational factors (e.g., bad lighting, not enough sleep the night before, noise in the testing room, lucky guesses, etc.) which can cause a person to score higher or lower on the test than his/her true ability or level alone would yield. In the true score measurement model, we assume that this error is random in nature, that for any individual these factors are as likely to inflate or deflate their observed score. There are models for simulating data that make different assumptions about what influences observed scores, but the true score model is one of the simplest and is the most commonly assumed.
You will use this true score model to generate imaginary pretest and posttest scores for 50 hypothetical persons. This will be accomplished using a pair of dice. For each person you will roll the pair of dice once to generate a score representing true ability, once to generate pretest measurement error and once to generate posttest measurement error. These values should be entered for each person in the appropriate columns in Table 1-1. You will then construct a pretest using the simple formula
X = T + eX
where X is the pretest, T is the true ability (simply the sum of the roll of a pair of dice) and eX is pretest measurement error (also based on the sum of the roll of a pair of dice). In real life this is all you would be given, and you would assume that each test score is a reflection of some true ability and random error. You would not see the two components; you only see the observed score. Similarly, you will then construct a posttest score using the formula
Y = T + eY
where Y is the posttest, T the same true score that is used for the pretest and eY is posttest measurement error (based on the sum of yet another roll of the pair of dice).
This procedure can be made clearer by doing it. Notice that the first column in Table 1-1 lists the numbers of the persons in the study, from 1 to 50. You will begin by generating a pretest and posttest score for person 1. First, roll the pair of dice once and sum the values (this will be a score between 2 and 12). This is called the true score. Enter the value in the first row of column 2. This score represents the true ability or level (T) of person 1 on this measure. Repeat this step for all 50 persons.
Second, roll two dice and place their sum in the first row of column 3. This number represents the error in measurement on the pretest (eX). Repeat this for all 50 persons. Third, roll the pair of dice again and place their sum in the first row of column 4. This value represents error in measurement on the posttest (eY). Again, repeat this for all 50 persons. You have now created an imaginary true score and errors in measurement for all 50 persons, recording the results in the appropriate columns.
Now you are going to construct the observed pretest and posttest scores. This requires only simple addition. For the first person (row) take the true score (T) from column 2 and add it to the pretest error value (eX) from column 3. Place this sum in column 5 (the pretest, X). Do this for all 50 people. Now, for the first person, add the true score (T) from column 2 to the posttest error value (eY) from column 4. Place this sum in column 6 (the posttest, Y). Do this for all 50 people.
It would be worth stopping at this point to think about what you have done. You have been creating imaginary test scores. You have constructed two tests called X and Y. Both of these imaginary tests measure the same trait because both of them share the same true score. The true score reflects the true ability of each person on this imaginary or simulated test. In addition, each test has its own random error. If this were real life, of course, you would not be constructing test scores like this. Instead, you would simply be given the two sets of observed test scores, X and Y. You would assume that the two measures have a common true score and independent errors but would not see these. Thus, you have generated simulated data. The advantage of using such data is that, unlike with real data, you know how the X and Y tests are constructed because you constructed them. You will see in later simulations that this enables you to test different analyses to see if they give the results that you put into the data. If the analyses work on simulated data, then, you may assume that they will also work for real data as long as the real data meet the assumptions of the measurement model used in the simulations.
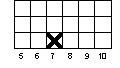
Next, you are going to look at the pretest and posttest data you simulated. Let's do this by graphing the pretest and posttest histograms. Figure 1-1 can be used to graph the pretest. Begin with the first person's pretest (X) value in column 5. Locate the column on Figure 1-1 for that value and make an 'X' in the first row of that column on the figure. For instance, if the first person has a pretest score of 7, your graph should look like:
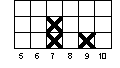
Now continue plotting the pretest values for the 50 people. If you come to a value that you already had before, place your 'X' in the row above the last 'X' you made for that value. For instance, if the second person had a pretest score of 9 and the third had a score of 7, your graph for these first three people would look like:
Repeat this for the pretest scores for all 50 people. Now, using Figure 1-2, repeat this process to draw the histogram for the posttest values in column 6.
Now let's estimate the central tendency for the pretest distribution shown in Figure 1-1. The best way to do this would be to calculate the mean or average of the 50 scores. But a quicker way to get a rough idea would be to locate the middle of the distribution by counting. Starting with the lowest column in which there is an 'X' in Figure 1-1, count the lowest 25 'Xs' in the figure. What column of Figure 1-1 is the 25th 'X' in? Simply put a mark at the bottom of the figure under this column to show that this is where the "center" of the distribution is located. Then, use the same counting procedure to estimate where the center is on the posttest histogram of Figure 1-2.
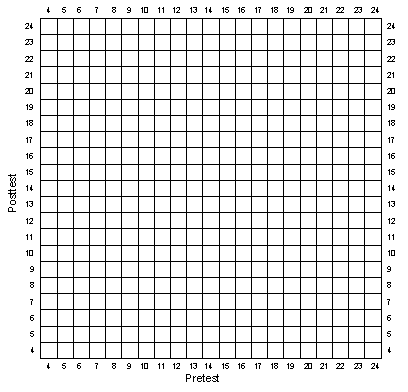
Now, let's look at the pretest and posttest scores together. You will graph their bivariate (i.e., two-variable) distribution on the graph in Figure 1-3. To do this, begin with the pretest and posttest score for person 1. Notice that the pretest is shown on the horizontal axis while the posttest is the vertical one. Go along the horizontal axis in Figure 1-3 until you come to the value for the pretest score for the first person. Now go up in that column until you come to the row that has the value for the posttest score for the first person. You are going to make a mark in the box that represents the pretest (column) and posttest (row) value for the first person. But because there may be more than one person who has the same pretest and posttest score, you will want to use a system to mark the box that allows you to see how many people of the fifty have a pre-post pair in any box. We recommend that you use the following system.
For the first mark in a specific box, do
 .
The second time you find a person with the same pre/post pair, add another diagonal
.
The second time you find a person with the same pre/post pair, add another diagonal
 .
For a third case, add a vertical line
.
For a third case, add a vertical line
 .
If there is a fourth, add a horizontal line
.
If there is a fourth, add a horizontal line
 .
.
It is not likely that you will have any more than four cases in any given box, but if you do, create a way to indicate this. In this manner, plot all of the pre/post pairs for the 50 persons in your simulation.
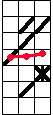
Now let's try to fit a line through this bivariate distribution in Figure 1-3. To do this, begin with the leftmost column on the graph. For each column, you are going to try to estimate its central tendency. If there are no marks in a column, skip that column and move to the next column to the right. If there are marks in the column, place a dot halfway between the lowest and highest mark in that column. If there is only one mark in a column, just place the dot in that row. Note that there will only be one dot per column. (This is, admittedly, a rough and simplified way to estimate central tendency. If you want to be more accurate, you can calculate the average posttest score for all persons having the same pretest score and place your mark accordingly.) Nevertheless, our rough estimation procedure should approximate the central tendency well enough for our purposes here. Now, beginning with the dot farthest to the left, connect the dots in adjacent columns with a line. Because it may be hard to distinguish this line from the bivariate marks you made in the boxes, you might want to connect these dots using a different colored pen. The figure below shows how a part of your bivariate plot with the dots and connecting lines might look:
Is the line that connects the dots in your graph relatively smooth? or very jagged? Is it a flat (horizontal) line? or not? Does this line tell you anything about the relationship between the pretest and posttest? It should be clear that the X and Y tests are positively related to each other, that is, higher scores on one test tend to be associated with higher scores on the other.
Now, you should again stop to consider what you have done. In the first part of the exercise you generated two imaginary tests — X and Y. In the second part, the bivariate graph showed you that the two tests are positively related to each other. You set them up to be related by including the same true ability score in both tests. You should think about the following points:
- If you had generated data for thousands of persons, the pretest and posttest distributions would look nearly identical. Furthermore, the estimates of pretest and posttest central tendency (e.g., averages) would be nearly identical and both distributions would have equal numbers of persons on either side of the central values. You can get a better sense of this if you compare your graphs with those of other persons who do this exercise.
- Each score (pretest and posttest) is composed of equal parts of true ability and random error. This is a common (although simplistic) measurement model called the "true score" model. Because we only have one true score for each test, we are assuming that each test is unidimensional, that is, measures only one trait. A factor analysis of both tests should yield one factor.
- The amounts of true score and error which are present in a test determine the reliability of the test. If you had used two parts true score to one part error, you would have more reliable tests; if you had used one part true score to two parts error, less reliable tests. (Specifically, reliability is defined as the ratio of the variance of the true scores to the variance of the total or observed score.)
- The pretest and posttest are related because they both share the same true score. (If you had generated separate pretest and posttest true scores there would be no relationship between the two tests.) But the relationship between pretest and posttest is far from perfect because each test has independent measurement error. In this example, if you computed the correlation it would be about .5.
- The line that you fit to the bivariate distribution is a very rough approximation to a regression line. You should be convinced that if you had thousands of persons, the best line through the data would be a straight line with a slope equal to about .5. (If the variances of the two variables are equal, as in this example, the correlation would be equal to the slope of the regression line. You can see whether the variances appear equal by looking at the spread of the scores around the central values in the pretest and posttest frequency distributions.)
Generating Data — Table 1-1
| Person | True Score (T) | Pretest Error (eX) | Posttest Error (eY) | Pretest X | Posttest Y |
|---|---|---|---|---|---|
| 1 | |||||
| 2 | |||||
| 3 | |||||
| 4 | |||||
| 5 | |||||
| 6 | |||||
| 7 | |||||
| 8 | |||||
| 9 | |||||
| 10 | |||||
| 11 | |||||
| 12 | |||||
| 13 | |||||
| 14 | |||||
| 15 | |||||
| 16 | |||||
| 17 | |||||
| 18 | |||||
| 19 | |||||
| 20 | |||||
| 21 | |||||
| 22 | |||||
| 23 | |||||
| 24 | |||||
| 25 | |||||
| 26 | |||||
| 27 | |||||
| 28 | |||||
| 29 | |||||
| 30 | |||||
| 31 | |||||
| 32 | |||||
| 33 | |||||
| 34 | |||||
| 35 | |||||
| 36 | |||||
| 37 | |||||
| 38 | |||||
| 39 | |||||
| 40 | |||||
| 41 | |||||
| 42 | |||||
| 43 | |||||
| 44 | |||||
| 45 | |||||
| 46 | |||||
| 47 | |||||
| 48 | |||||
| 49 | |||||
| 50 |
Generating Data — Figure 1-1
Generating Data — Figure 1-2
Generating Data — Figure 1-3